Personalized Graphics
Our world is more connected with each passing minute. 7.7 billion people use many times that number of devices, creating a exponentially growing digital signature. Our data not only describes who we are, but what we have done and where we have been, what we like and what we want, and what we are likely going to do or purchase next. In the last decade it has become clear that these mountains of qualitative data drive the world economy. Something making up such a significant portion of our lives should be visualized, right?
A modern neural network might pick at all the numbers describing our lives to learn our behavioral trends. This may in turn become another data point to sell to marketers. As humans, it's nearly impossible to glean meaningful insight from a set of numbers. A journalist can bring insight to the reader via a graphic, and can bring a certain creative human element a machine might not be able to. An automatic tool will likely fit a set of points into a prepackaged plot, and may offer a description of a trend. It cannot however critically evaluate the data on an entry by entry basis like a human can.
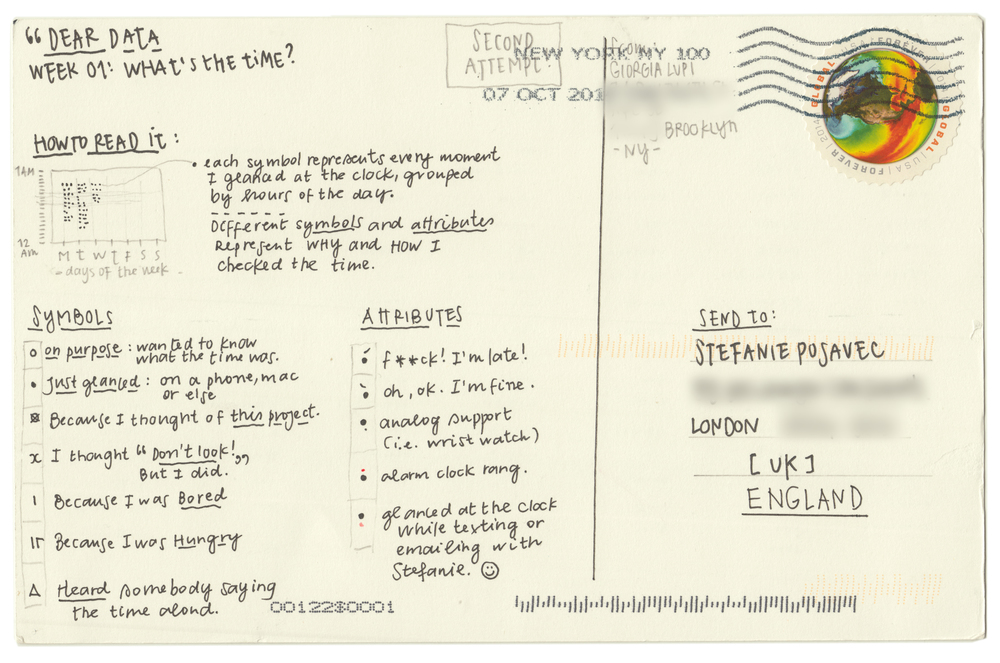
In her "Dear Data" postcards, Giorgia Lupi shows her habits of looking at the clock. It's easy to record what times she looked at the clock, but simply recording a list of times is uninteresting and uninsightful. She instead puts a twist on the visualization by including what she was thinking each instance she checked the time. This perspective provides us a look into her mood throughout the day, her general schedule, and even shares some of her personality.


Plug and play visualization tools may be quick and easy to use, but will present the driest data. In a world where we are surrounded by trillions of numbers, there will be dozens of ways to visualize all aspects of life in an interesting, creative way.

0 Comments:
Post a Comment
Subscribe to Post Comments [Atom]
<< Home